
“人生苦短,我用Python”
Python语言被很多人推崇的原因之一是Python社区贡献的各种各样的库和工具。无论你想做什么,基本上都能找到对应的库,虽然不一定完成度有多好。Jupyter Notebook是其中提及率很高的一款强大工具,可以将代码运行的阶段性结果如图片表格等像笔记一样保存起来最终形成可阅读的笔记。
Jupyter Notebook原名Ipython Notebook,Jupyter这个名字据说取自其支持的三种语言 JUlia, PYThon,和 R,也可能是来自行星Jupiter即木星。
Jupyter Notebook以服务器的形式运行,以浏览器窗口作为前端与用户交互相对h传统IDE来说更加灵活,社区也贡献了一些插件,使其具有不错的扩展性。
阅读博文28 Jupyter Notebook tips, tricks, and shortcuts的时候一遍看一遍敲,就记下这许多。其实基本上就是原文的简略版,加了一点自己的理解。
这样的总结博文里的内容,里面的Feature肯定不是全部都用的到,就算只用其中几个,能提升效率也是极好的。希望每次重读的时候,能多发掘一两个好用的功能。
Table of Contents
- 1 快捷键 Keyboard Shortcuts
- 2 显示所有单行变量
- 3 快速文档Easy links to documentation[和
Shift+Tab功能相同] - 4 Notebook页内绘图Plotting in notebooks
- 5 魔法命令IPython Magic Commands
- 6
%env设置环境变量 - 7
%run运行外部Python代码 - 8
%load从外部脚本插入代码 - 9
%store在笔记间传递变量 - 10
%who列出所有全局变量 - 11 魔法命令-代码计时
- 12
%%writefile/%pycat导出/导入外部脚本 - 13 %pdb调试
- 14
%prun分析代码运行时间 - 15 绘图高分辨率显示
- 16 不显示结果Suppress the output of a final function.
- 17 执行Shell命令
- 18 使用Latex公式
- 19 Notebook内用不同kernel运行代码Run code from a different kernel in a notebook
- 20 安装其他kernel
- 21 同时运行R和Python代码
- 22 用其他语言写部分函数Writing functions in other languages
- 23 多光标
- 24 Jupyter 插件
- 25 利用Jupyter Notebook制作Presentation
- 26 Jupyter输出系统The Jupyter output system
- 27 大数据处理'Big data' analysis
- 28 共享笔记 Sharing notebooks
- 29 补充
快捷键 Keyboard Shortcuts
通过点击菜单中的Help > Keyboard Shortcuts或在命名模式下按H键都可以查看Jupyter Notebook的快捷键。
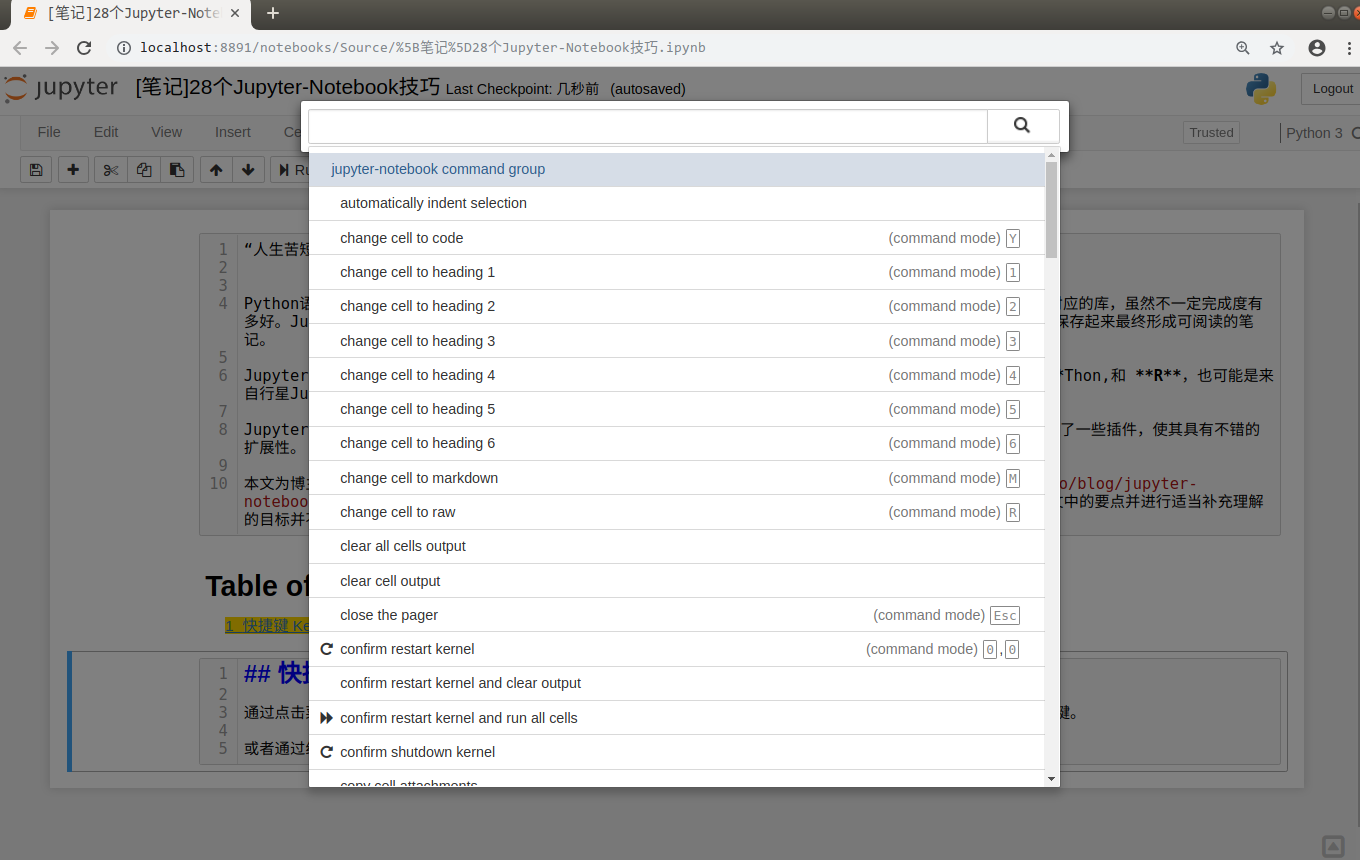
或者通过组合快捷键Ctrl + Shift + P调出command palette来搜索相应的功能,如图所示
一些常用快捷键:
Esc进入命令模式Enter从命令模式进入编辑模式Esc+A在当前cell上方插入cellB在当前cell下方插入cellM改变当前cell为Markdown模式Y改变当前cell为code模式D+D删除当前cell
Shift + Tab产看当前函数/变量/类的Docstring,可以多次点按调出不同详细程度的DocstringCtrl + Shift + -从光标处拆分当前cellEsc + F查找 替换Esc + O折叠输出- 选中多个cell
Shift + J或Shift + Down朝下选择cellShift + KorShift + Up朝上选择cell 一旦选中多个cell,就可以像对单单一cell一样进行删除/复制/剪切/粘贴/运行了Shift + M合并多个cell
显示所有单行变量
Jupyter Notebook运行后会自动打印cell最后一行的变量
通过修改ast_note_interactivity变量,Jupyter Notebook可以显示所有单行变量
import numpy as np
import pandas as pd

ndarray = np.random.random((20, 10))
df = pd.DataFrame(ndarray)

df.head()
df.tail()
from IPython.core.interactiveshell import InteractiveShell
InteractiveShell.ast_node_interactivity = "all"
df.head()

df.tail()
如果想全局设置,执行Shell命令
ipython profile create
在~/.ipython/profile_default/生成ipython_config.py和ipython_kernel_config.py文件,修改ipython_config.py添加如下行
c = get_config()

# Run all nodes interactively
c.InteractiveShell.ast_node_interactivity = "all"
?str.replace()
Signature: str.replace(self, old, new, count=-1, /)
Docstring:
Return a copy with all occurrences of substring old replaced by new.

  count
    Maximum number of occurrences to replace.
    -1 (the default value) means replace all occurrences.

If the optional argument count is given, only the first count occurrences are
replaced.
Type:      method_descriptor
会弹出Docstring
这一方法和前文提到的Shift+Tab功能相同
Notebook页内绘图Plotting in notebooks
- matplotlib
%matplotlib inline魔法命令使得matplotlib绘图可以在笔记内显示 %matplotlib notebook为交互式绘图,会有些慢- Seaborn 只需
import seaborn就可以让matplot的图好看一些 - mpld3
- plot.ly
- Altair
魔法命令IPython Magic Commands
上文所述%matplotlib inline就是一个魔法命令
# 列出所有魔法命令
%lsmagic
以下为一些非常有用的魔法命令
%env 设置环境变量
无需重启Notebook即可修改环境变量
%env OMP_NUM_THREADS=4
%run 运行外部Python代码
注意,这个导入模块不同,仅仅是运行代码
% matplotlib inline
%run ./two-histograms.py

%load从外部脚本插入代码
这一命令执行后会在当前cell的自动插入外部脚本的代码
执行前
%load ./two-histograms.py
执行后
# %load ./two-histograms.py
import numpy as np
import matplotlib.pyplot as plt

# Fixing random state for reproducibility
np.random.seed(19680801)

mu, sigma = 100, 15
x = mu + sigma * np.random.randn(10000)

# the histogram of the data
n, bins, patches = plt.hist(x, 50, density=True, facecolor='g', alpha=0.75)


plt.xlabel('Smarts')
plt.ylabel('Probability')
plt.title('Histogram of IQ')
plt.text(60, .025, r'$\mu=100,\ \sigma=15$')
plt.axis([40, 160, 0, 0.03])
plt.grid(True)
plt.show()
%store 在笔记间传递变量
在原Notebook中
data = 'this is the string I want to pass to different notebook'
%store data
del data # 删除变量
在新的Notebook中
%store -r data # 重新载入变量
print(data)
this is the string I want to pass to different notebook
%who 列出所有全局变量
可以指定数据类型
one = "for the money"
two = "for the show"
three = "to get ready now go cat go"

%who str
%who int
魔法命令-代码计时
%%time 与 %%timeit
%%time 单次执行
%%timeit调用Python timeit 模块,默认执行100000次
这两个魔法命令都可以使用%或%%区别在于单行还是整个cell
%%time

import numpy as np

ndarray = np.random.random(100)
%timeit ndarray = np.random.random(100)
%%timeit

ndarray = np.random.random(100)
ndarray1 = np.random.random(100)
%%writefile/ %pycat导出/导入外部脚本
%%writefile 将当前cell的内容导出到外部文件中,%pycat正好相反(在弹出窗口显示)
%%writefile pythoncode.py

import numpy
def append_if_not_exists(arr, x):
    if x not in arr:
        arr.append(x)

def some_useless_slow_function():
    arr = list()
    for i in range(10000):
        x = numpy.random.randint(0, 10000)
        append_if_not_exists(arr, x)
%pycat pythoncode.py
%pdb

import numpy

def pick_and_take():

    picked = numpy.random.randint(0, 1000)
    raise NotImplementedError()

pick_and_take()
%prun分析代码运行时间
在弹出窗口显示每个函数的代码运行时间
def useless(n):
    return [x for x in range(n) if x % 2 == 0]
%%prun

useless(100)
         5 function calls in 0.000 seconds

   Ordered by: internal time

   ncalls  tottime  percall  cumtime  percall filename:lineno(function)
        1    0.000    0.000    0.000    0.000 {built-in method builtins.exec}
        1    0.000    0.000    0.000    0.000 <ipython-input-1-5b23640614a7>:2(<listcomp>)
        1    0.000    0.000    0.000    0.000 <ipython-input-1-5b23640614a7>:1(useless)
        1    0.000    0.000    0.000    0.000 <string>:3(<module>)
        1    0.000    0.000    0.000    0.000 {method 'disable' of '_lsprof.Profiler' objects}
绘图高分辨率显示
%config InlineBackend.figure_format = 'retina'
x = np.linspace(0, 1000)
y = 2*x
plt.plot(x,y)
plt.show();

%config InlineBackend.figure_format = 'retina'
plt.plot(x,y)
plt.show();

%matplotlib inline
from matplotlib import pyplot as plt
import numpy
x = numpy.linspace(0, 1, 1000)**1.5
plt.hist(x)

plt.hist(x);
执行Shell命令
在命令前加!即可直接在Notebook中执行
# 列出所有ipynb文件
!ls *.ipynb
#安装plotly
!pip install plotly
使用Latex公式
r"\\( P(A \mid B) = \frac{P(B \mid A) \, P(A)}{P(B)} \\)"
$ P(A \mid B) = \frac{P(B \mid A) \, P(A)}{P(B)} $
行间公式
$$P(A \mid B) = \frac{P(B \mid A) \, P(A)}{P(B)} $$行内公式
$P(A \mid B) = \frac{P(B \mid A) \, P(A)}{P(B)} $$P(A \mid B) = \frac{P(B \mid A) \, P(A)}{P(B)} $
Notebook内用不同kernel运行代码Run code from a different kernel in a notebook
选项
- %%bash
- %%HTML
- %%python2
- %%python3
- %%ruby
- %%perl
同时运行R和Python代码
使用rpy2模块
用其他语言写部分函数Writing functions in other languages
安装 cython 和 fortran-magic
!pip install cython fortran-magic
%load_ext Cython
%%cython

def myltiply_by_2(float x):
    return 2.0 * x
myltiply_by_2(23.)
多光标
按住Ctrl鼠标左键单击即可
Jupyter 插件
安装并激活插件和插件管理器
!pip install jupyter_contrib_nbextensions
!pip install jupyter_nbextensions_configurator
!jupyter contrib nbextension install --user
!jupyter nbextensions_configurator enable --user
利用Jupyter Notebook制作Presentation
安装RISE插件并激活
pip install RISE
jupyter-nbextension install rise --py --sys-prefix
jupyter-nbextension enable rise --py --sys-prefix
import os
from IPython.display import display, Image
names = [f for f in os.listdir('./img/') if f.endswith('.png') or f.endswith('.jpg')]
for name in names:
    display(Image('./img/' + name, width=100))


共享笔记 Sharing notebooks
- 通过菜单
File > Download as > HTML将笔记转换为Html文件 - 通过菜单
File > Download as > PDF将笔记转换为PDF文件 - 通过Gist 或将文件上传到GitHub
- jupyterhub
- 通过nbviewer在线渲染GitHub或DropBox上的文件
- 利用Pelican和ipynb文件搭建个人博客
更多信息以及文中介绍的一些资源网站链接,参考原文