import matplotlib
import matplotlib.pyplot as plt
import matplotlib.pylab as pylab
from mpl_toolkits.mplot3d import Axes3D
import numpy as np
%matplotlib inline
%config InlineBackend.figure_format = 'retina'
Matplotlib 设置全家桶
matplotlib 中的 figsize 对应的图片大小并不是分辨率,在 word 中直接体现为粘贴进去之后图片的长宽尺寸有多少英尺,而 dpi 决定了图片的清晰程度。
可用的 rcParams key
可以通过这些 key 调整图片的各种属性
pylab.rcParams.keys()
设置中文字体,解决Matplotlib不能显示中文的问题
font_name = "SimHei"
# 指定字体,实际上相当于修改 matplotlibrc 文件 只不过这样做是暂时的 下次失效
matplotlib.rcParams['font.family'] = font_name
matplotlib.rcParams['axes.unicode_minus'] = False  # 正确显示负号,防止变成方框
matplotlib 中的 figsize 图片大小,对应的是粘贴到 word 里的宽高,单位为英寸
1英寸=2.54厘米
使用比例 宽:高 = 4:3
论文写作指南推荐的三种图片比例
原始厘米     转换英寸     取整英寸
6.67 * 5.00   2.62 * 1.95   2.6 * 1.95    适合双栏
9.00 * 6.75   3.54 * 2.66   3.5 * 2.625   适合普通单栏
13.5 * 9.00   5.31 * 3.54   5.4 * 4.05    适合较大图片
我下面的模板没有按照这个尺寸
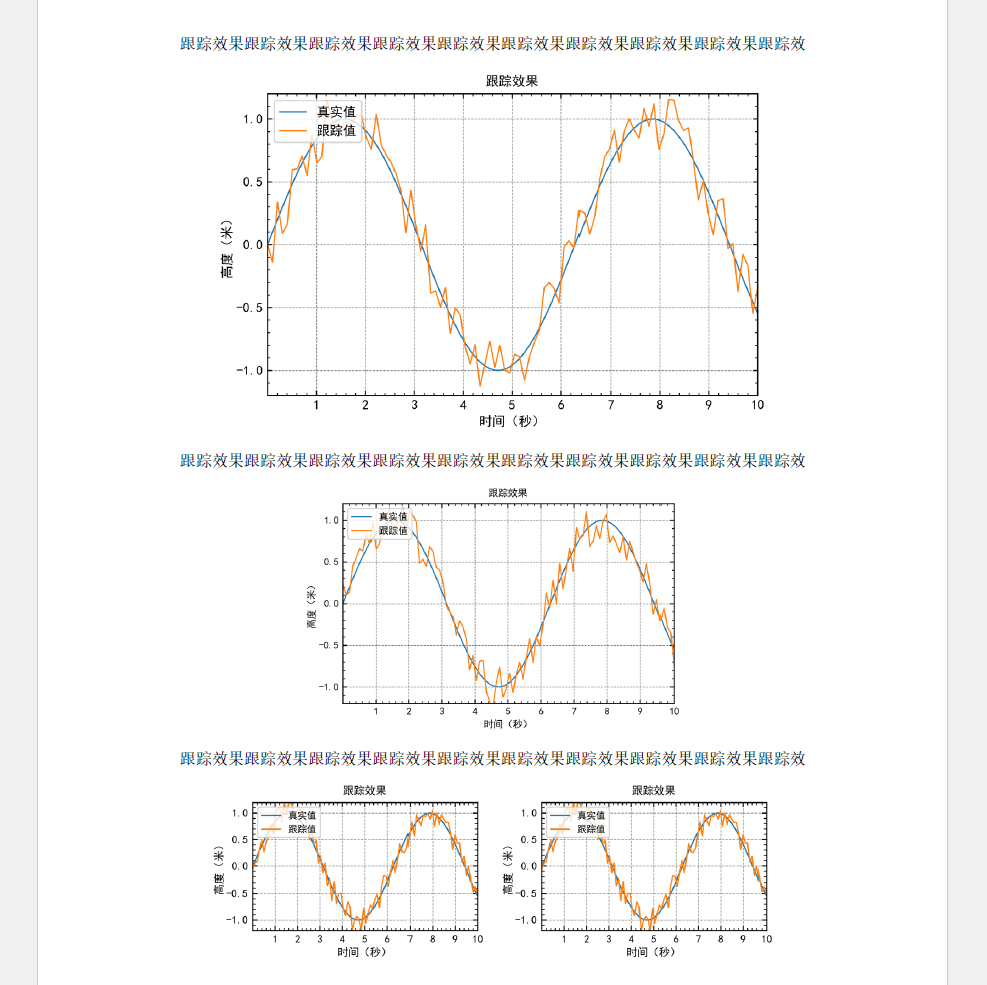
较大单栏图片
# 绘图参数,一次搞定
params = {
    'font.size': '10',
    'axes.titlesize': '10',
    'axes.labelsize': '10',
    'xtick.labelsize': '10',
    'ytick.labelsize': '10',
    'lines.linewidth': '1',
    'legend.fontsize': '10',
    'axes.labelpad': '3.0',
    'figure.figsize': '6, 4',
}
pylab.rcParams.update(params)
t = np.linspace(0, 10, 100)
# y = [47.0567, 50.1325, 50.3974, 46.4238, 51.5894, 50.1325, 47.2185, 45.7616, 54.7682, 49.7351]
y = np.sin(t)
y_ = y + 0.5*(np.random.random(t.shape[0])-0.5)

fig, ax = plt.subplots()

ax.plot(t, y, label=u"真实值")
ax.plot(t, y_, label=u'跟踪值')

ax.set_title(u'跟踪效果')
ax.set_xlabel(u'时间(秒)')
ax.set_ylabel(u'高度(米)')
ax.set_xlim(0, 10)
ax.set_ylim(-1.2, 1.2)
ax.set_xticks(np.arange(1, 11))
ax.legend(loc=2)  # upper left corner
ax.minorticks_on()  # 显示小刻度
ax.tick_params(which='both', direction='in',
               bottom=True, top=True, left=True, right=True)  # 控制坐标轴显示与否以及方向, which选择主次坐标刻度
ax.grid(color='k', alpha=0.5, linestyle='dashed', linewidth=0.5)
fig.tight_layout()
# plt.grid(True)
plt.savefig("data/test1.png", bbox_inches='tight', dpi=500)
plt.savefig("data/test1.pdf", bbox_inches='tight')
plt.savefig("data/test1.svg", bbox_inches='tight')

普通单栏图片
# 绘图参数,一次搞定
params = {
    'font.size': '8',
    'axes.titlesize': '8',
    'axes.labelsize': '8',
    'xtick.labelsize': '8',
    'ytick.labelsize': '8',
    'lines.linewidth': '1',
    'legend.fontsize': '8',
    'axes.labelpad': '3.0',
    'figure.figsize': '4.5, 3',
}
pylab.rcParams.update(params)
t = np.linspace(0, 10, 100)
# y = [47.0567, 50.1325, 50.3974, 46.4238, 51.5894, 50.1325, 47.2185, 45.7616, 54.7682, 49.7351]
y = np.sin(t)
y_ = y + 0.5*(np.random.random(t.shape[0])-0.5)

fig, ax = plt.subplots()

ax.plot(t, y, label=u"真实值")
ax.plot(t, y_, label=u'跟踪值')

ax.set_title(u'跟踪效果')
ax.set_xlabel(u'时间(秒)')
ax.set_ylabel(u'高度(米)')
ax.set_xlim(0, 10)
ax.set_ylim(-1.2, 1.2)
ax.set_xticks(np.arange(1, 11))
ax.legend(loc=2)  # upper left corner
ax.minorticks_on()  # 显示小刻度
ax.tick_params(which='both', direction='in',
               bottom=True, top=True, left=True, right=True)  # 控制坐标轴显示与否以及方向, which选择主次坐标刻度
ax.grid(color='k', alpha=0.5, linestyle='dashed', linewidth=0.5)
fig.tight_layout()
# plt.grid(True)
plt.savefig("data/test2.png", bbox_inches='tight', dpi=500)
plt.savefig("data/test2.pdf", bbox_inches='tight')
plt.savefig("data/test2.svg", bbox_inches='tight')

双栏图片
# 绘图参数,一次搞定
params = {
    'font.size': '8',
    'axes.titlesize': '8',
    'axes.labelsize': '8',
    'xtick.labelsize': '8',
    'ytick.labelsize': '8',
    'lines.linewidth': '1',
    'legend.fontsize': '7',
    'axes.labelpad': '2.0',
    'figure.figsize': '3, 2',
}
pylab.rcParams.update(params)
t = np.linspace(0, 10, 100)
# y = [47.0567, 50.1325, 50.3974, 46.4238, 51.5894, 50.1325, 47.2185, 45.7616, 54.7682, 49.7351]
y = np.sin(t)
y_ = y + 0.5*(np.random.random(t.shape[0])-0.5)

fig, ax = plt.subplots()

ax.plot(t, y, label=u"真实值")
ax.plot(t, y_, label=u'跟踪值')

ax.set_title(u'跟踪效果')
ax.set_xlabel(u'时间(秒)')
ax.set_ylabel(u'高度(米)')
ax.set_xlim(0, 10)
ax.set_ylim(-1.2, 1.2)
ax.set_xticks(np.arange(1, 11))
ax.legend(loc=2)  # upper left corner
ax.minorticks_on()  # 显示小刻度
ax.tick_params(which='both', direction='in',
               bottom=True, top=True, left=True, right=True)  # 控制坐标轴显示与否以及方向, which选择主次坐标刻度
ax.grid(color='k', alpha=0.5, linestyle='dashed', linewidth=0.5)
fig.tight_layout()
# plt.grid(True)
plt.savefig("data/test3.png", bbox_inches='tight', dpi=500)
plt.savefig("data/test3.pdf", bbox_inches='tight')
plt.savefig("data/test3.svg", bbox_inches='tight')

在 word 中显示比例对比
直接使用png文件粘贴,宽度在word内分别按比例调整为 13 9 6.67厘米
在 Word 中粘贴矢量图
- 场景1 代码生成
Word 中无法粘贴 eps 和 pdf 图片,Python 或 matlab 输出的 svg 文件本身可以直接粘贴到 Word 中,但这样 Word 文件另存为 pdf 时会存在线条加粗的情况,具体原因未知。替代方法是,将 svg 粘贴至 ppt 中,复制之后按快捷键 Ctrl + Alt + V 选择性粘贴,粘贴转换为 图片(增强性图元文件)即 emf 文件,再将该图片粘贴至 Word 中即可。不过粘贴为 emf 文件过程中,图片的尺寸(宽、高厘米数)会发生一点变化,既然是矢量图,都是能缩放的,大小也就无所谓了。这样粘贴到 Word 中的就是矢量图了
- 场景2 手动绘制
使用 PPT 或 Visio 绘图,复制选择性粘贴为 图片(增强性图元文件),之后再粘贴到 Word 中。
转换为增强性图元文件会导致图片尺寸的变化(放大一些),不影响比例,且可能导致某些线条的粗细由于渲染问题出现变化
快速画图初始化代码
fig, ax = plt.subplots()
# ax.set_aspect('equal','box') # 设置坐标轴比例

t = np.linspace(0, 2*np.pi, 50, endpoint=False)
sins = np.sin(t)
coss = np.cos(t)

ax.plot(t, sins, 'r', alpha=0.5, lw=0.5, ls='-', marker='+', label='sin')
ax.plot(t, coss, 'g', alpha=0.5, lw=0.5, ls='-', marker='+', label='cos')

ax.set_title('title')
ax.set_xlabel('x')
ax.set_ylabel('y')
ax.set_ylim([-1.5, 1.5])
ax.set_xlim([-2, 8])
# xticks = [1, 2, 3, 4, 5]
# ax.set_xticks(xticks)
# ax.set_xticklabels([r'$\alpha$', r'$\beta$', r'$\gamma$', r'$\delta$', r'$\epsilon$'], fontsize=18)
# yticks = [0, 1, 2, 3, 4]
# ax.set_yticks(yticks)
# ax.set_yticklabels(["$%.1f$" % y for y in yticks], fontsize=18); # use LaTeX formatted labels
# ax.set_yscale("log")
# ax.xaxis.labelpad = 5
# ax.yaxis.labelpad = 5
ax.legend(loc='lower right')
ax.minorticks_on()  # 显示小刻度
ax.tick_params(which='both', direction='in',
               bottom=True, top=True, left=True, right=True)  # 控制坐标轴显示与否以及方向, which选择主次坐标刻度
# ax.spines['right'].set_color("none") # 取消右边坐标轴的显示
ax.grid(color='k', alpha=0.5, linestyle='dashed', linewidth=0.5)

# fig.subplots_adjust(left=0.15, right=.9, bottom=0.1, top=0.9)  # 调整绘图在整个画布中的位置
fig.savefig("data/test4.png", bbox_inches='tight', dpi=500)
fig.savefig("data/test4.pdf", bbox_inches='tight')
fig.savefig("data/test4.svg", bbox_inches='tight')
plt.show()

一个比较好看的 cmap
t = np.linspace(0, 2*np.pi, 1000, endpoint=True)
y = np.sin(t)
cs = matplotlib.cm.rainbow(np.linspace(0, 1, 1000))

plt.scatter(t, y, color=cs, alpha=0.5)

Matplot 3d 柱状图
axes.bar3d(x, y, z, dx, dy, dz, color=None, zsort='average', shade=True, *args, **kwargs)
注意进行 ravel 操作
fig = plt.figure(figsize=(16, 6))
ax1 = fig.add_subplot(121, projection='3d')
ax2 = fig.add_subplot(122, projection='3d')

_xx, _yy = np.meshgrid(np.arange(4), np.arange(5))
x, y = _xx.ravel(), _yy.ravel()

top = x + y
z = np.zeros_like(top)
dx = dy = 0.5

ax1.bar3d(x, y, z, dx, dy, top, shade=True)
ax1.set_title('Shaded')

ax2.bar3d(x, y, z, dx, dy, top, shade=False)
ax2.set_title('Not Shaded')

for e in (ax1, ax2):
    e.w_xaxis.set_pane_color((1.0, 1.0, 1.0, 1.0))
    e.w_yaxis.set_pane_color((1.0, 1.0, 1.0, 1.0))
    e.w_zaxis.set_pane_color((1.0, 1.0, 1.0, 1.0))

plt.show()

3d plot 视角调整
view_init(elev=None, azim=None)
Set the elevation and azimuth of the axes. This can be used to rotate the axes programatically. ‘elev’ stores the elevation angle in the z plane. ‘azim’ stores the azimuth angle in the x,y plane. if elev or azim are None (default), then the initial value is used which was specified in the Axes3D constructor.
elev 是 z 平面的角度 azim 是 xy 平面角度
实际上可以在 add_subplot 的时候指定角度
ax = fig.add_axes([0, 0, .95, 1], elev=48, azim=134, projection='3d')
fig = plt.figure(figsize=(8, 6))
ax = fig.add_subplot(111, projection='3d')

_xx, _yy = np.meshgrid(np.arange(4), np.arange(5))
x, y = _xx.ravel(), _yy.ravel()

top = x + y
z = np.zeros_like(top)
dx = dy = 0.5

ax.bar3d(x, y, z, dx, dy, top, shade=True)
ax.set_title('Shaded')

for e in (ax,):
    e.w_xaxis.set_pane_color((1.0, 1.0, 1.0, 1.0))
    e.w_yaxis.set_pane_color((1.0, 1.0, 1.0, 1.0))
    e.w_zaxis.set_pane_color((1.0, 1.0, 1.0, 1.0))

ax1.view_init(20, 320)  # 调整角度
plt.show()
