最近看了一本很有意思的书,Nicolas P. Rougier的From Python to Numpy。其中有一小节Blue noise sampling,讲的是所谓的面向问题的代码向量化,很有意思,简单记录一下。(当然,向量化的代码可以提升计算机对内存的调度效率,但也同时面临着代码的可维护性以及扩展性问题)
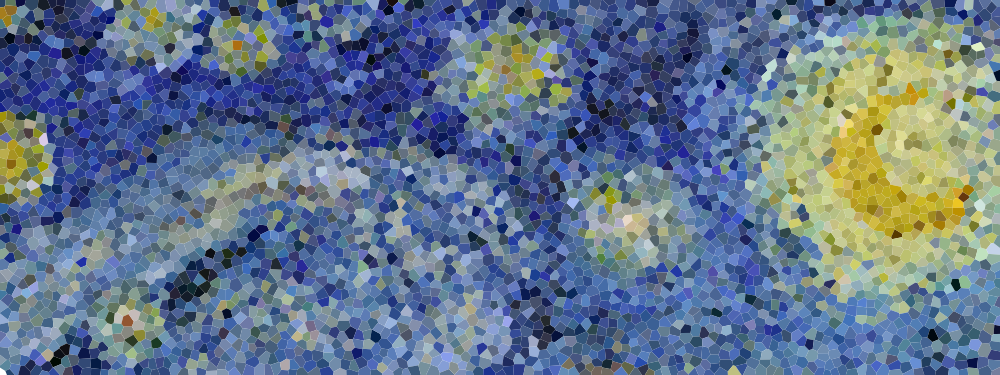
蓝噪声是指均匀分布的随机无偏噪声,在图像领域有广泛的应用,题图为梵高的名画“繁星点点The Starry Night”进行蓝噪声采样后得到的图像。生成蓝噪声的方法有很多,其中最简单的要数DART方法。
所谓图像采样,即在图像内选取若干个点作为采样点,用这些采样点的情况(色彩,透明度)描述该点对应的周围一个区域的整体色彩情况。
那么所谓蓝噪声采样,就是生成n维空间内符合蓝噪声标准的均匀分布的一系列点,对图像(n维空间数据)进行采样,以使得采样尽可能的均匀。(这里的采样不是简单的按均匀分布随机生成n维坐标值,因为这样得到的分布其均匀性并不好)
为什么不使用均匀采样/随机(基于均匀分布)采样的方法?
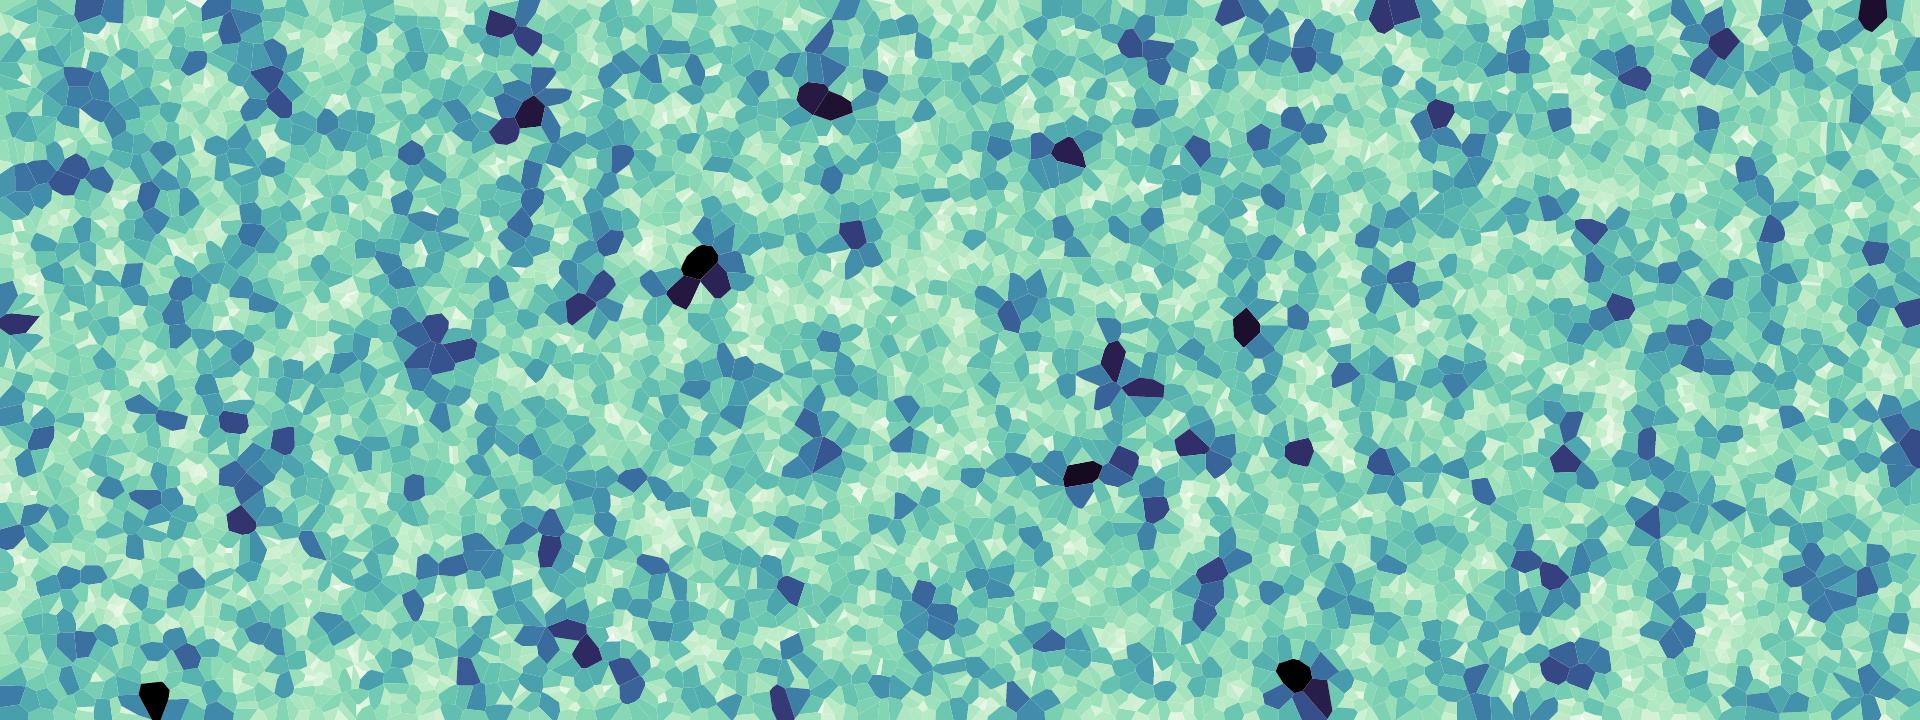
事实证明,均匀分布或者简单的随机分布的采样点,得到的采样效果并不好。下图可视化了在平面上随机生成6667个采样点后,得到的采样点对应的采样面积的分布情况,颜色越深表示其面积与其他点对应的采样面积差距越大。

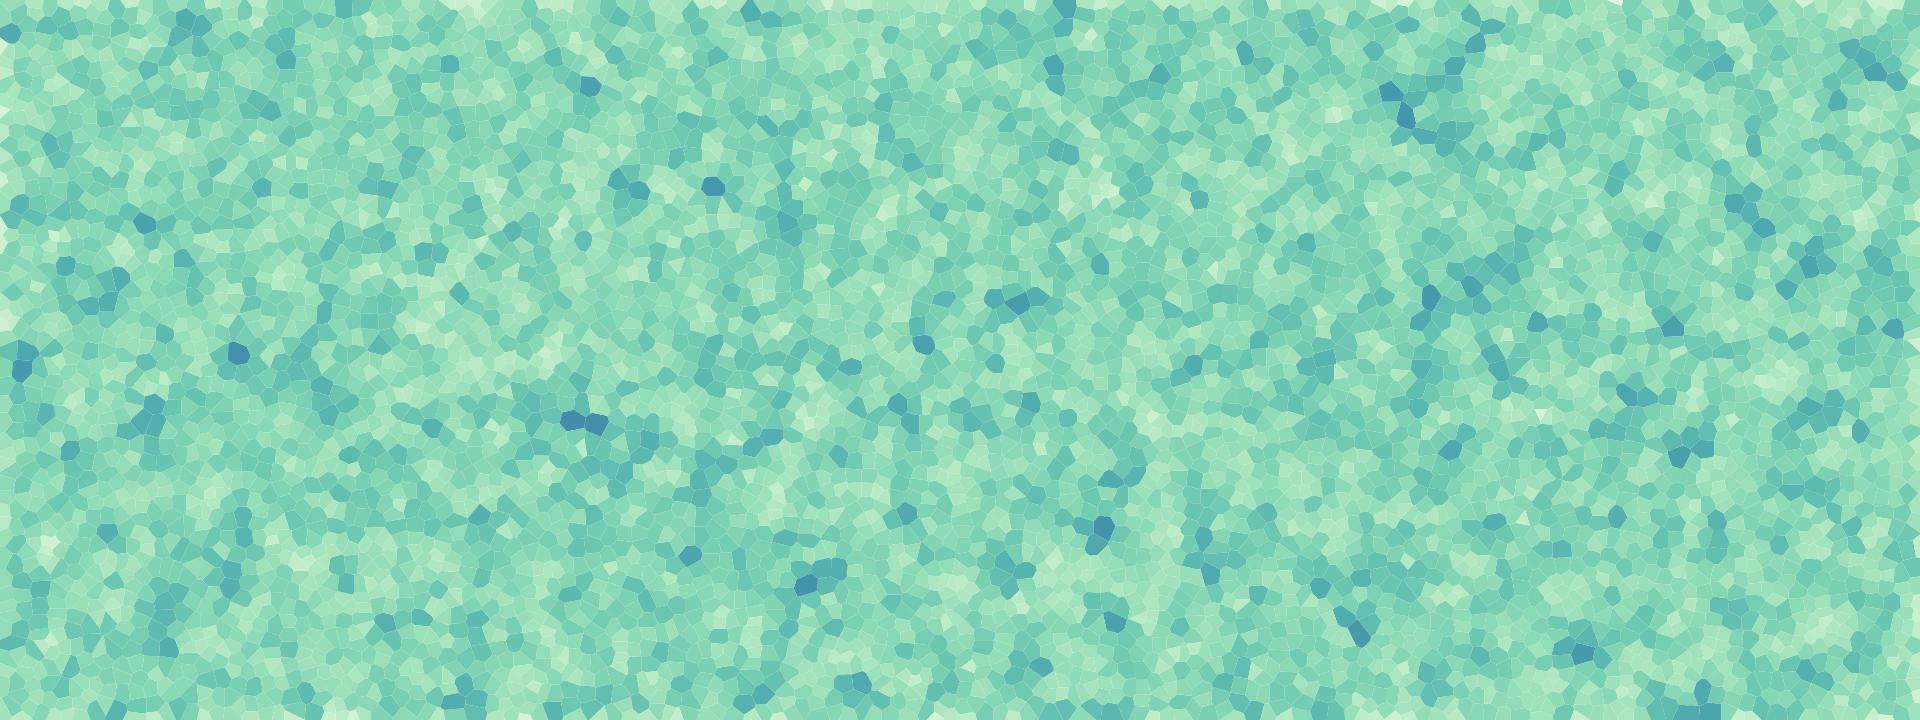
可以看到,有一些点分布的确实不那么“随机”/“均匀”。下图是采用DART算法得到的点的分布情况,每个点所对应的面积分布变得更平均了。

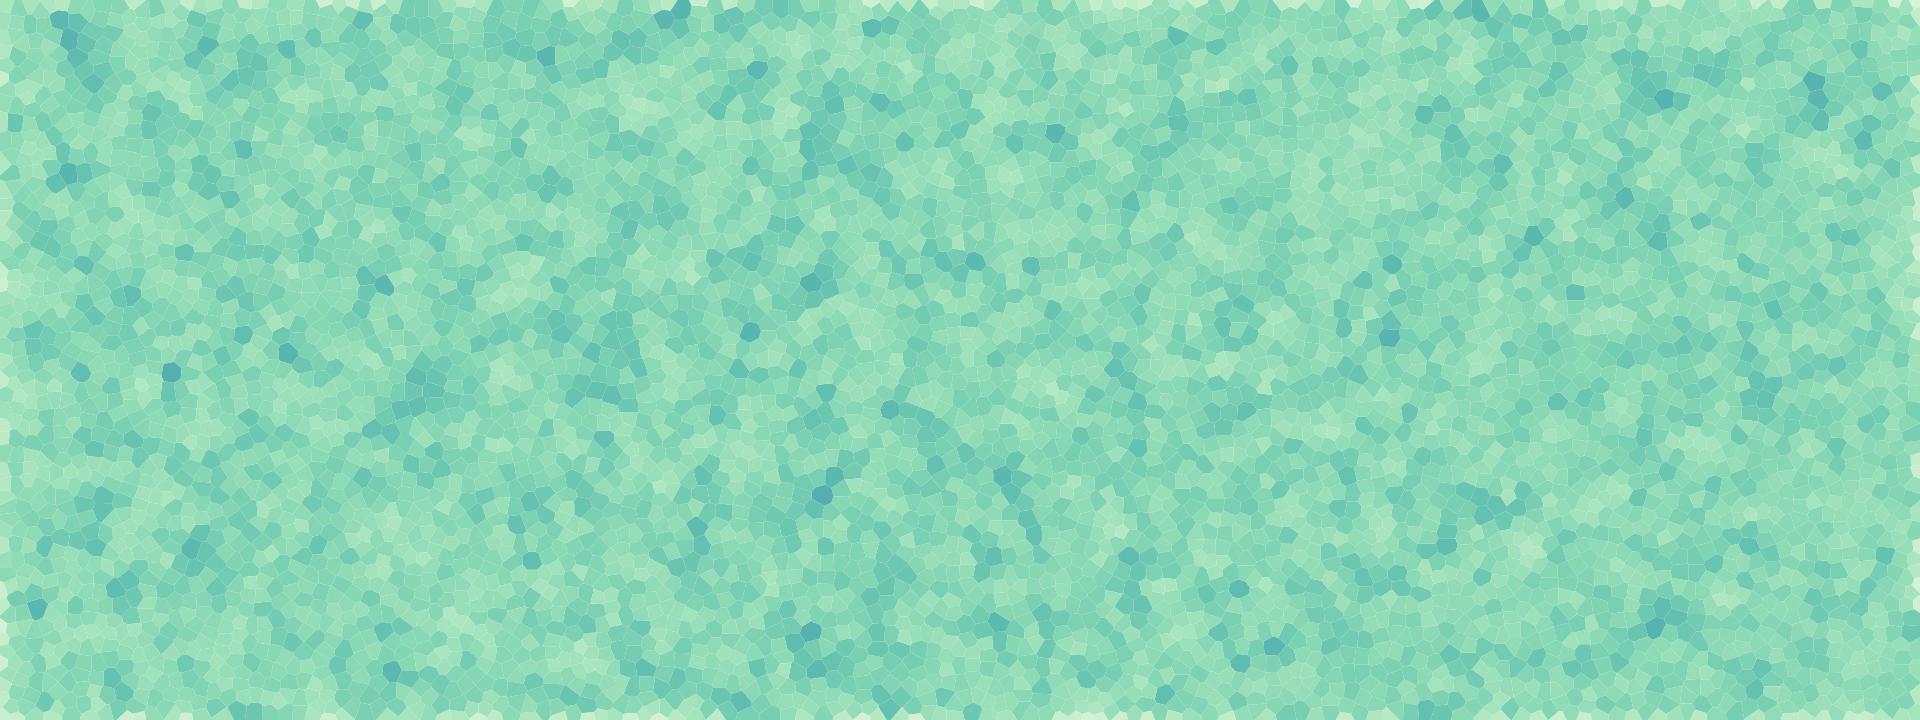
下图为采用Bridson方法进行采样得到的采样点的分布情况,每个点对应的采样面积更加均匀了,该算法不仅效果更好,而且速度也更快。

DART方法
DART是最早的图像采样方法,通过不断生成随机点,并检测该点与所有已经接受的点之间的距离,若该点与所有已接受的点之间的距离都大于某个阈值,则将该点也加入已接受点的列表中,否则放弃该点。从DART的方法中可以推断,当已接受的点越来越多时,会导致算法运行速度变得异常缓慢,因为生成的点需要计算和所有已经接受的点之间的距离。
考虑单位面积的平面,以及距离阈值$r$,已知在平面内堆叠圆的最佳方案时类似蜂巢的正六边形摆放法,得到的最大密度为$d=\frac{1}{6} \pi \sqrt{3}$(为什么?)。那么理论上,单位面积内可以摆放的点的个数即 $\frac{d}{\pi r^{2}}=\frac{\sqrt{3}}{6 r^{2}}=\frac{1}{2 r^{2} \sqrt{3}}$。
考虑到已接受的点越多,增加新的点就越困难,额外设置失败计数,当连续多次生成的点都不符合要求时,终止算法。
import math
import random
import numpy as np
import matplotlib
import matplotlib.pyplot as plt
from matplotlib.path import Path
from matplotlib.patches import PathPatch
%matplotlib inline
Python写法
def DART_sampling_python(width=1.0, height=1.0, radius=0.025, k=100):
def squared_distance(p0, p1):
dx, dy = p0[0]-p1[0], p0[1]-p1[1]
return dx*dx+dy*dy
points = []
i = 0
last_success = 0
while True:
x = random.uniform(0, width)
y = random.uniform(0, height)
accept = True
for p in points:
if squared_distance(p, (x, y)) < radius*radius:
accept = False
break
if accept is True:
points.append((x, y))
if i-last_success > k:
break
last_success = i
i += 1
return points
matplotlib.rcParams['toolbar'] = 'None'
fig = plt.figure(figsize=(3, 3), dpi=200, facecolor='white')
ax = fig.add_axes([0, 0, 1, 1], frameon=True, aspect=1)
points = DART_sampling_python()
print("DART_sampling_python,", len(points), "points in total")
X = [x for (x, y) in points]
Y = [y for (x, y) in points]
ax.scatter(X, Y, s=5, lw=0.5, edgecolor='k', facecolor="None")
ax.set_xlim(0, 1)
ax.set_ylim(0, 1)
ax.set_xticks([])
ax.set_yticks([])
plt.show()
NumPy写法
以上代码使用的是纯Python的写法,对其进行一定的改造,对代码进行向量化。向量化的关键就是预先生成一系列点,并计算每对点之间的距离,然后在此基础上进行选择。
def DART_sampling_numpy(width=1.0, height=1.0, radius=0.025, k=100):
# 计算理论限制的最大点数
n = int((width+radius)*(height+radius) / (2*(radius/2)
* (radius/2)*np.sqrt(3))) + 1 # 不知道这里为什么是 r/2
# 5倍理论极限
n = 5*n
# 生成随机点
P = np.zeros((n, 2))
P[:, 0] = np.random.uniform(0, width, n)
P[:, 1] = np.random.uniform(0, height, n)
# 计算成对的点之间的距离
from scipy.spatial.distance import cdist
D = cdist(P, P)
# 对角线上的无意义点赋个较大的值
D[range(n), range(n)] = 1e10
points, indices = [P[0]], [0]
i = 1
last_success = 0
# ==========================
# i 标签只增不减,这是个不太好解释的做法(可能不是最好的做法)
# ==========================
while i < n and i - last_success < k:
if D[i, indices].min() > radius:
indices.append(i)
points.append(P[i])
last_success = i
i += 1
return points
matplotlib.rcParams['toolbar'] = 'None'
fig = plt.figure(figsize=(3, 3), dpi=200, facecolor='white')
ax = fig.add_axes([0, 0, 1, 1], frameon=True, aspect=1)
points = DART_sampling_numpy()
print("DART_sampling_numpy,", len(points), "points in total")
X = [x for (x, y) in points]
Y = [y for (x, y) in points]
ax.scatter(X, Y, s=5, lw=0.5, edgecolor='k', facecolor="None")
ax.set_xlim(0, 1)
ax.set_ylim(0, 1)
ax.set_xticks([])
ax.set_yticks([])
plt.show()
Bridson方法
以上代码向量化方法,对算法的速度提升很有限,且采样的质量依然依赖于k参数的设置。可以通过提高k的值来提高采样效果,但这样的效率非常低下。Robert Bridson提出了一种新的采样方法,可以更有效地对任意维空间进行采样。
Step1:首先,对n维空间进行网格划分,可以加速代码执行速度。确保网格的任意边长不大于$\frac{r}{\sqrt{n}}$(对应n维空间一个网格内的最长距离即对角线长度为$r$时的边长),因此每个网格内最多只能有一个采样点。
Step2:任意生成一个初始采样点$x_{0}$,将其加入已接受采样点集合中并标记其所在网格为非空状态(标记网格是为了计算临近点距离更加方便),同时将其加入采样点的active list。
Step3:当active list非空时,从active list中任意选取一个采样点,在其周围$r$到$2r$范围内随机生成k个点。对这些点进行遍历,若某个点不在任意已接受采样点半径$r$范围内,则将该点加入已接受采样点集合中,并标记其所在网格为非空状态。
在整个算法执行过程中,active list中点的数量呈先增长后下降的趋势。
NumPy写法
'''
my modified version
'''
def Bridson_sampling(width=1.0, height=1.0, radius=0.025, k=30):
# 计算两点之间距离的平方
def squared_distance(p0, p1):
return (p0[0]-p1[0])**2 + (p0[1]-p1[1])**2
# 生成某一点周围一定半径范围内“均匀分布”的随机点,虽然不是真随机,但忍了
def random_point_around(p, k=1):
R = np.random.uniform(radius, 2*radius, k) # 距离
T = np.random.uniform(0, 2*np.pi, k) # 角度
P = np.empty((k, 2)) # 目标点位置矩阵
P[:, 0] = p[0]+R*np.sin(T)
P[:, 1] = p[1]+R*np.cos(T)
return P
# 判断是否处于给定范围内
def in_limits(p):
return 0 <= p[0] < width and 0 <= p[1] < height
# 返回某个坐标周围n格范围内的坐标
def neighborhood(shape, index, n=2):
row, col = index
row0, row1 = max(row-n, 0), min(row+n+1, shape[0])
col0, col1 = max(col-n, 0), min(col+n+1, shape[1])
I = np.dstack(np.mgrid[row0:row1, col0:col1])
I = I.reshape(I.size//2, 2).tolist()
I.remove([row, col])
return I
def in_neighborhood(p):
i, j = int(p[0]/cellsize), int(p[1]/cellsize)
if M[i, j]:
return True
for (i, j) in N[(i, j)]:
if M[i, j] and squared_distance(p, P[i, j]) < squared_radius:
return True
return False
def add_point(p):
points.append(p)
i, j = int(p[0]/cellsize), int(p[1]/cellsize)
P[i, j], M[i, j] = p, True
# 2 对应空间维数,此时考虑平面,故为2
cellsize = radius/np.sqrt(2) # 划分网格的边长
rows = int(np.ceil(width/cellsize)) # 网格行数
cols = int(np.ceil(height/cellsize)) # 网格列数
squared_radius = radius*radius
P = np.zeros((rows, cols, 2), dtype=np.float32) # 用于存储网格内的点
M = np.zeros((rows, cols), dtype=bool) # 用于存储mask
# Cache generation for neighborhood
N = {}
for i in range(rows):
for j in range(cols):
N[(i, j)] = neighborhood(M.shape, (i, j), 2)
points = []
add_point((np.random.uniform(width), np.random.uniform(height)))
while len(points):
# print(len(points))
i = np.random.randint(len(points))
p = points[i]
Q = random_point_around(p, k)
success_in_k_trial = False
for q in Q:
if in_limits(q) and not in_neighborhood(q):
add_point(q)
if not success_in_k_trial:
del points[i]
return P[M]
matplotlib.rcParams['toolbar'] = 'None'
fig = plt.figure(figsize=(3, 3), dpi=200, facecolor='white')
ax = fig.add_axes([0, 0, 1, 1], frameon=True, aspect=1)
points = Bridson_sampling()
print("Bridson_sampling,", len(points), "points in total")
X = [x for (x, y) in points]
Y = [y for (x, y) in points]
ax.scatter(X, Y, s=5, lw=0.5, edgecolor='k', facecolor="None")
ax.set_xlim(0, 1)
ax.set_ylim(0, 1)
ax.set_xticks([])
ax.set_yticks([])
plt.show()
对比不同方法的效果,需要使用一种叫做voronoi的方法,用于根据采样点的位置根据最近原则划分出若干个区域,每个采样点与一个区域关联。每个区域内的所有位置,到该区域对应的采样点的距离比到其他采样点的距离更近。其原理如图所示。

参考 https://blog.csdn.net/kevin_darkelf/article/details/81455687
def circumcircle(P1, P2, P3):
"""
计算三点的外界圆 http://local.wasp.uwa.edu.au/~pbourke/geometry/circlefrom3/Circle.cpp
"""
delta_a = P2 - P1
delta_b = P3 - P2
epsilon = 0.000000001
if np.abs(delta_a[0]) <= epsilon and np.abs(delta_b[1]) <= epsilon:
center_x = 0.5*(P2[0] + P3[0])
center_y = 0.5*(P1[1] + P2[1])
else:
aSlope = delta_a[1]/delta_a[0]
bSlope = delta_b[1]/delta_b[0]
if np.abs(aSlope-bSlope) <= epsilon:
return None
center_x = (aSlope*bSlope*(P1[1] - P3[1]) + bSlope*(P1[0] + P2[0])
- aSlope*(P2[0]+P3[0]))/(2 * (bSlope-aSlope))
center_y = -1*(center_x - (P1[0]+P2[0])/2)/aSlope + (P1[1]+P2[1])/2
radius = np.sqrt((center_x - P1[0])**2+(center_y - P1[1])**2)
return center_x, center_y, radius
def voronoi(X, Y):
"""
计算若干个点形成的voronoi图
返回 Voronoi 格 (list of points), Delaunay 三角形 (list of indices in X and Y) 以及Delaunay 圆(list of x,y,radius).
"""
P = np.zeros((X.size, 2))
P[:, 0] = X
P[:, 1] = Y
D = matplotlib.tri.Triangulation(X, Y) # 直接调用matplotlib方法计算
T = D.triangles
n = T.shape[0]
C = np.zeros((n, 3))
# 计算每个三角形的外接圆,圆形即为三角形中心
cells = []
for i in range(X.size):
cells.append(list())
for i in range(n):
C[i] = circumcircle(P[T[i, 0]], P[T[i, 1]], P[T[i, 2]])
x, y, r = C[i]
cells[T[i, 0]].append((x, y))
cells[T[i, 1]].append((x, y))
cells[T[i, 2]].append((x, y))
# Reordering cell points in trigonometric way
for i, cell in enumerate(cells):
xy = np.array(cell)
I = np.argsort(np.arctan2(xy[:, 1]-Y[i], xy[:, 0]-X[i]))
cell = xy[I].tolist()
cell.append(cell[0])
cells[i] = cell
return cells, D.triangles, C
matplotlib.rcParams['toolbar'] = 'None'
fig = plt.figure(figsize=(3, 3), dpi=200, facecolor='white')
ax = fig.add_axes([0, 0, 1, 1], frameon=True, aspect=1)
X = np.random.random(200)
Y = np.random.random(200)
ax.scatter(X, Y, s=3, lw=0.5, edgecolor='k', facecolor="None")
segments = voronoi(X, Y)
lines = matplotlib.collections.LineCollection(segments[0], color='0.75')
ax.add_collection(lines)
ax.set_xlim(0, 1)
ax.set_ylim(0, 1)
ax.set_xticks([])
ax.set_yticks([])
plt.show()
对比不同方法的采样效果
def draw_voronoi(ax, X, Y):
'''
绘制voronoi图
'''
from matplotlib.path import Path
from matplotlib.patches import PathPatch
cells, triangles, circles = voronoi(X, Y)
for i, cell in enumerate(cells):
codes = [Path.MOVETO] \
+ [Path.LINETO] * (len(cell)-2) \
+ [Path.CLOSEPOLY]
path = Path(cell, codes)
patch = PathPatch(path,
facecolor="none", edgecolor="0.5", linewidth=0.5)
ax.add_patch(patch)
fig = plt.figure(figsize=(6, 6), dpi=200)
ax = plt.subplot(2, 2, 1, aspect=1)
n = 1024
X = np.random.uniform(0, 1, n)
Y = np.random.uniform(0, 1, n)
print("Random sampling,", n, "points in total")
ax.scatter(X, Y, s=1, color="k")
ax.set_xlim(0, 1), ax.set_ylim(0, 1)
ax.set_xticks([]), ax.set_yticks([])
ax.set_title("Random sampling", fontsize=9)
draw_voronoi(ax, X, Y)
ax = plt.subplot(2, 2, 2, aspect=1)
n = 32
X, Y = np.meshgrid(np.linspace(0, 1, n), np.linspace(0, 1, n))
print("Regular grid + jittering,", len(X)*len(Y), "points in total")
X += 0.45*np.random.uniform(-1/n, 1/n, (n, n))
Y += 0.45*np.random.uniform(-1/n, 1/n, (n, n))
ax.scatter(X, Y, s=1, color="k")
ax.set_xlim(0, 1), ax.set_ylim(0, 1)
ax.set_xticks([]), ax.set_yticks([])
ax.set_title("Regular grid + jittering", fontsize=9)
draw_voronoi(ax, X.ravel(), Y.ravel())
ax = plt.subplot(2, 2, 3, aspect=1)
points = DART_sampling_numpy(width=1.0, height=1.0, radius=0.025, k=150)
P = np.vstack(points)
print("DART_sampling_numpy,", len(P), "points in total")
plt.scatter(P[:, 0], P[:, 1], s=1, color="k")
ax.set_xlim(0, 1), ax.set_ylim(0, 1)
ax.set_xticks([]), ax.set_yticks([])
ax.set_title("DART sampling numpy", fontsize=9)
draw_voronoi(ax, P[:, 0], P[:, 1])
ax = plt.subplot(2, 2, 4, aspect=1)
P = Bridson_sampling(width=1.0, height=1.0, radius=0.025, k=30)
print("Bridson_sampling,", len(P), "points in total")
plt.scatter(P[:, 0], P[:, 1], s=1, color="k")
ax.set_xlim(0, 1), ax.set_ylim(0, 1)
ax.set_xticks([]), ax.set_yticks([])
ax.set_title("Bridson sampling", fontsize=9)
draw_voronoi(ax, P[:, 0], P[:, 1])
plt.tight_layout()
plt.savefig("data/sampling.png")
plt.show()
从图中可以看到,简单的按均匀分布随机生成横纵坐标,最终得到的voronoi图,每一采样块大小差异较大。
蓝噪声在群智能中的应用
说句题外话,博主在做一些集群机器人仿真实验时,需要在平面内初始化若干个机器人,使用随机的初始化方法时,效果就如同图中Random sampling一样,实际上这些机器人在平面内的分布并不那么平均。之后可以考虑将这种图像采样算法用于平面内集群机器人的位置初始化上。
不过这种方法对采样点数的控制不大方便,可能不太适合需要精确控制集群规模的情况???
图片马赛克化
首先利用Bridson方法生成图片的采样点,之后按照采样点对图像进行采样,利用voronoi方法依据采样点的采样值,在采样点对应范围内绘制填充图。
def mosaic(pic_path, n_grid=100):
from scipy import misc
import imageio
img = imageio.imread(pic_path)
height, width, depth = img.shape
fig = plt.figure(figsize=(8, 8*(height/width)), dpi=200)
ax = fig.add_axes([0.0, 0.0, 0.5, 1.0], frameon=False, aspect=1)
radius = min(height, width)/n_grid
P = Bridson_sampling(width=width-0.1, height=height -
0.1, radius=radius, k=30)
ax.set_xlim(0, width)
ax.set_ylim(0, height)
ax.set_xticks([])
ax.set_yticks([])
ax.set_title("mosaic", fontsize=10)
X, Y = P[:, 0], P[:, 1]
cells, triangles, circles = voronoi(X, height-Y) # 调整Y坐标
for i, cell in enumerate(cells):
codes = [Path.MOVETO] + [Path.LINETO]*(len(cell)-2) + [Path.CLOSEPOLY]
path = Path(cell, codes)
color = img[int(np.floor(Y[i])), int(np.floor(X[i]))] / 255.0
patch = PathPatch(path, facecolor=color, edgecolor="none")
ax.add_patch(patch)
ax = fig.add_axes([0.5, 0.0, 0.5, 1.0], frameon=False, aspect=1)
ax.set_xlim(0, width)
ax.set_ylim(0, height)
ax.set_xticks([])
ax.set_yticks([])
ax.set_title("original", fontsize=10)
ax.imshow(img[::-1, :, :]) # 调整Y坐标
import os
plt.savefig(os.path.splitext(pic_path)[
0]+"_mosaic"+os.path.splitext(pic_path)[1])
plt.show()
mosaic("data/huihui.jpg")
mosaic("data/starry-night.jpg")
mosaic("data/starry-night.jpg", 20)